Python Lectures
Pandas DataFrame
DataFrames hold tabular data. Here we will read a csv file as a DataFrame and mess with it.
- This cell just downloads the file from a url. Take a few minutes and see if you can change it to be generally useful by allowing the url and save location to be specified as arguments. Hint, you need to change very little, and you don’t really need to know how the function works in any detail.
import requests
from pathlib import Path

def get_NZ_file():
  '''
  A purposefully bad function to download one specific file.
  '''
  # url to Dec 2024 NZ GH emissions by industry (long url!)
  url = 'https://www.stats.govt.nz/assets/Uploads/Greenhouse-gas-emissions-industry-and-household/Greenhouse-gas-emissions-industry-and-household-December-2024-quarter/Download-data/greenhouse-gas-emissions-industry-and-household-december-2024-quarter.csv'
  # make a dir for data, if does not exist
  save_dir = Path.cwd() / 'data'
  save_dir.mkdir(exist_ok=True)
  # get file name
  basename = url.split('/')[-1]
  # and a directory to save to
  save_path = save_dir / basename

  try:
      response = requests.get(url, stream=True)
      # raise HTTPError for bad responses (4xx or 5xx)
      response.raise_for_status()
      with open(save_path, 'wb') as file:
        for chunk in response.iter_content(chunk_size=8192):
          file.write(chunk)
      print(f"File downloaded successfully to {save_path}")

  except requests.exceptions.RequestException as e:
    print(f'An error occurred: {e}')
  except Exception as e:
    print(f'An unexpected error occurred: {e}')

  return save_path

file_path = get_NZ_file()
File downloaded successfully to /home/michael/CP/geog441/data/greenhouse-gas-emissions-industry-and-household-december-2024-quarter.csv- Read the csv, and look at the head (first few rows). Notice that there are column names, and on the left side there is a numerical index.
| Anzsic | Anzsic_descriptor | Gas | Period | Data_value | Variable | Units | Magnitude | |
|---|---|---|---|---|---|---|---|---|
| 0 | AAZ | Agriculture, forestry, fishing | Carbon dioxide equivalents | 2010.03 | 10875 | Seasonally adjusted | Kilotonnes | Carbon dioxide equivalents |
| 1 | AAZ | Agriculture, forestry, fishing | Carbon dioxide equivalents | 2010.06 | 11003 | Seasonally adjusted | Kilotonnes | Carbon dioxide equivalents |
| 2 | AAZ | Agriculture, forestry, fishing | Carbon dioxide equivalents | 2010.09 | 10993 | Seasonally adjusted | Kilotonnes | Carbon dioxide equivalents |
| 3 | AAZ | Agriculture, forestry, fishing | Carbon dioxide equivalents | 2010.12 | 10914 | Seasonally adjusted | Kilotonnes | Carbon dioxide equivalents |
| 4 | AAZ | Agriculture, forestry, fishing | Carbon dioxide equivalents | 2011.03 | 11014 | Seasonally adjusted | Kilotonnes | Carbon dioxide equivalents |
We can also see the last few rows if we want.
| Anzsic | Anzsic_descriptor | Gas | Period | Data_value | Variable | Units | Magnitude | |
|---|---|---|---|---|---|---|---|---|
| 4795 | ZZZ | Total | Nitrous oxide | 2023.12 | 1708 | Actual | Kilotonnes | Carbon dioxide equivalents |
| 4796 | ZZZ | Total | Nitrous oxide | 2024.03 | 1615 | Actual | Kilotonnes | Carbon dioxide equivalents |
| 4797 | ZZZ | Total | Nitrous oxide | 2024.06 | 1482 | Actual | Kilotonnes | Carbon dioxide equivalents |
| 4798 | ZZZ | Total | Nitrous oxide | 2024.09 | 1652 | Actual | Kilotonnes | Carbon dioxide equivalents |
| 4799 | ZZZ | Total | Nitrous oxide | 2024.12 | 1662 | Actual | Kilotonnes | Carbon dioxide equivalents |
Or we can slice from the middle using index slicing, just like with a list.
| Anzsic | Anzsic_descriptor | Gas | Period | Data_value | Variable | Units | Magnitude | |
|---|---|---|---|---|---|---|---|---|
| 100 | BB1 | Mining | Carbon dioxide equivalents | 2020.03 | 307 | Seasonally adjusted | Kilotonnes | Carbon dioxide equivalents |
| 101 | BB1 | Mining | Carbon dioxide equivalents | 2020.06 | 256 | Seasonally adjusted | Kilotonnes | Carbon dioxide equivalents |
| 102 | BB1 | Mining | Carbon dioxide equivalents | 2020.09 | 280 | Seasonally adjusted | Kilotonnes | Carbon dioxide equivalents |
| 103 | BB1 | Mining | Carbon dioxide equivalents | 2020.12 | 271 | Seasonally adjusted | Kilotonnes | Carbon dioxide equivalents |
| 104 | BB1 | Mining | Carbon dioxide equivalents | 2021.03 | 276 | Seasonally adjusted | Kilotonnes | Carbon dioxide equivalents |
There are many other ways to select from Pandas DataFrames.
The Period column gives dates, but they are in a format that will be interpreted as floats (e.g. 20007.08). Here we change them to datetimes and use them to set the index, giving us a DateTime index.
Earlier we mentioned methods, and we saw that strings have method split() which splits the string. Columns in Pandas that are of the type str, that is to say string, have all of the same methods under an attribute called str.
This cell uses many methods strung together to change the Period column to DateTime format and set the index.
| Anzsic | Anzsic_descriptor | Gas | Period | Data_value | Variable | Units | Magnitude | |
|---|---|---|---|---|---|---|---|---|
| Period | ||||||||
| 2010-03-01 | AAZ | Agriculture, forestry, fishing | Carbon dioxide equivalents | 2010.03 | 10875 | Seasonally adjusted | Kilotonnes | Carbon dioxide equivalents |
| 2010-06-01 | AAZ | Agriculture, forestry, fishing | Carbon dioxide equivalents | 2010.06 | 11003 | Seasonally adjusted | Kilotonnes | Carbon dioxide equivalents |
| 2010-09-01 | AAZ | Agriculture, forestry, fishing | Carbon dioxide equivalents | 2010.09 | 10993 | Seasonally adjusted | Kilotonnes | Carbon dioxide equivalents |
| 2010-12-01 | AAZ | Agriculture, forestry, fishing | Carbon dioxide equivalents | 2010.12 | 10914 | Seasonally adjusted | Kilotonnes | Carbon dioxide equivalents |
| 2011-03-01 | AAZ | Agriculture, forestry, fishing | Carbon dioxide equivalents | 2011.03 | 11014 | Seasonally adjusted | Kilotonnes | Carbon dioxide equivalents |
See what gasses are measured by looking at unique values in the Gas column.
array(['Carbon dioxide equivalents', 'Methane', 'Carbon dioxide',
'Fluorinated gases', 'Nitrous oxide'], dtype=object)Text(0.5, 0, 'Year')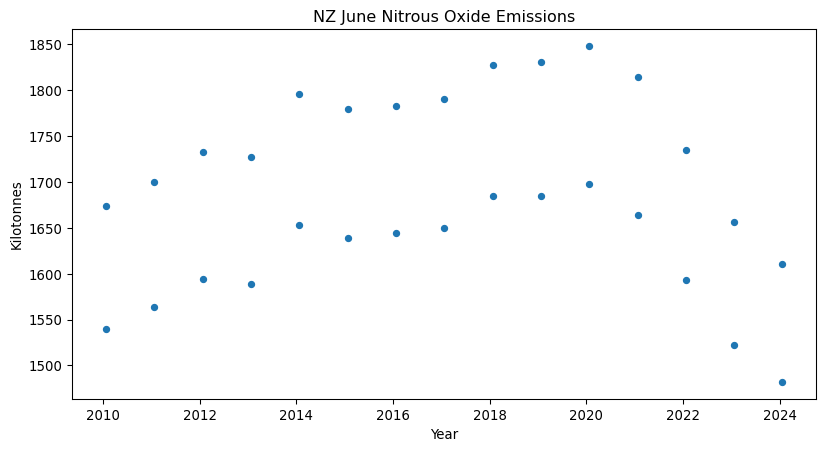
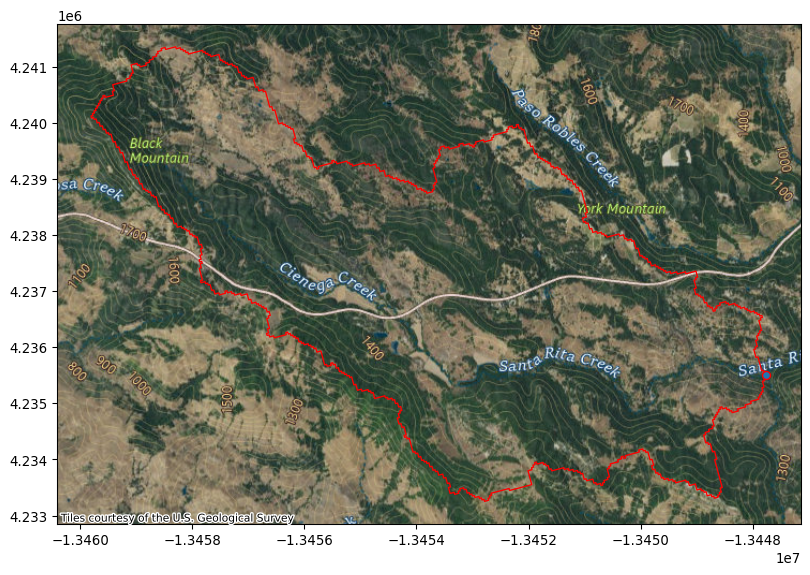
Polygon

Reading Files
Here we will read a geojson using the read_file method.
| id | geometry | |
|---|---|---|
| 0 | globalwatershedpoint | POINT (-120.80331 35.52537) |
| 1 | globalwatershed | POLYGON ((-120.81096 35.50944, -120.81161 35.5... |
| community | NID | POP2010 | POP2000 | POPCH | POPPERCH | popplus | popneg | geometry | |
|---|---|---|---|---|---|---|---|---|---|
| 0 | DOUGLAS | 35 | 18238 | 26470 | -8232 | -31.099358 | 0 | 1 | MULTIPOLYGON (((-87.60914 41.84469, -87.60915 ... |
| 1 | OAKLAND | 36 | 5918 | 6110 | -192 | -3.142390 | 0 | 1 | MULTIPOLYGON (((-87.59215 41.81693, -87.59231 ... |
| 2 | FULLER PARK | 37 | 2876 | 3420 | -544 | -15.906433 | 0 | 1 | MULTIPOLYGON (((-87.6288 41.80189, -87.62879 4... |
| 3 | GRAND BOULEVARD | 38 | 21929 | 28006 | -6077 | -21.698922 | 0 | 1 | MULTIPOLYGON (((-87.60671 41.81681, -87.6067 4... |
| 4 | KENWOOD | 39 | 17841 | 18363 | -522 | -2.842673 | 0 | 1 | MULTIPOLYGON (((-87.59215 41.81693, -87.59215 ... |
Plot Cloropleth
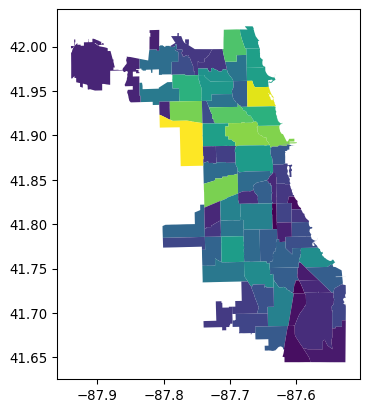
The Chicago example is taken from GeoPandas Mapping and plotting tools tutorial, which you should take a look at.